Giải đề thi thật Writing Task 1 - 28/12/2024
The chart below shows the water levels of 6 cities in Australia in October 2009 and 2010. Summarise the information by selecting and reporting the main features and make comparisons where relevant.
The chart below shows the water levels of 6 cities in Australia in October 2009 and 2010. Summarise the information by selecting and reporting the main features and make comparisons where relevant.
ldeas và dàn bài
INTRODUCTION
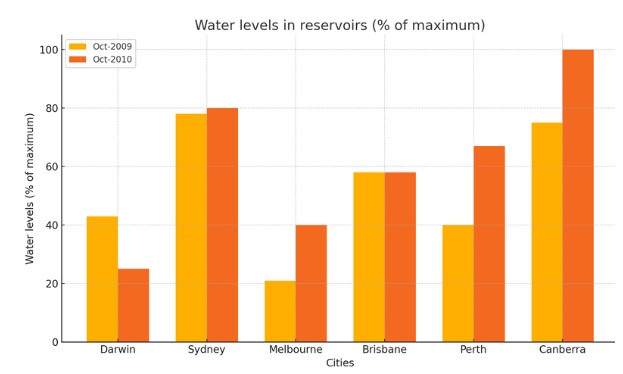
Biểu đồ thanh minh họa tỷ lệ mực nước trong các hồ chứa tại sáu thành phố của Úc (Darwin, Sydney, Melbourne, Brisbane, Perth và Canberra) vào tháng 10 năm 2009 và tháng 10 năm 2010.
OVERVIEW
Nhìn chung, mực nước trong hồ chứa thay đổi khác nhau giữa các thành phố trong hai năm. Một số thành phố có sự thay đổi đáng kể, trong khi một số khác ổn định hơn.
BODY 1
Năm 2009
- Canberra và Sydney có mực nước cao nhất, lần lượt khoảng 75% và 78%.
- Brisbane xếp thứ ba với khoảng 58%.
- Perth và Darwin có mực nước thấp hơn, lần lượt là 40% và 43%.
- Melbourne có mức thấp nhất, chỉ khoảng 21%, cho thấy tình trạng thiếu nước có thể xảy ra.
BODY 2
Năm 2010
- Mực nước của Melbourne tăng gấp đôi, đạt 40%.
- Perth ghi nhận mức tăng đáng kể, đạt khoảng 67%.
- Darwin giảm mạnh, từ 43% xuống còn 25%.
- Sydney tăng nhẹ lên 80%, tiếp tục duy trì vị trí cao nhất.
- Brisbane không thay đổi, giữ mức 58%.
- Canberra giảm nhẹ xuống khoảng 70%.
Bài mẫu Band 8.0
The bar chart illustrates the percentage of water levels in reservoirs for six Australian cities—Darwin, Sydney, Melbourne, Brisbane, Perth, and Canberra—in October 2009 and October 2010.
Overall, it is evident that water levels varied across the cities over the two years, with notable changes in some cities and stability in others.
In October 2009, Canberra and Sydney had the highest reservoir levels, at approximately 75% and 78%, respectively, indicating well-maintained water resources. Brisbane followed with around 58%, while Perth and Darwin recorded lower percentages at 40% and 43%. Melbourne stood out with the lowest levels, at roughly 21%, reflecting potential water scarcity.
By October 2010, significant shifts were observed. Melbourne’s levels doubled to 40%, and Perth experienced a marked increase to about 67%, reflecting improvements. In contrast, Darwin saw a steep decline from 43% to 25%. Sydney’s levels grew slightly to 80%, maintaining its high ranking. Brisbane remained steady at 58%, while Canberra experienced a slight drop to around 70%.
(180 words)